Nutrient Density
At the center of Dr. Fuhrman’s Nutritarian diet is a simple health equation:
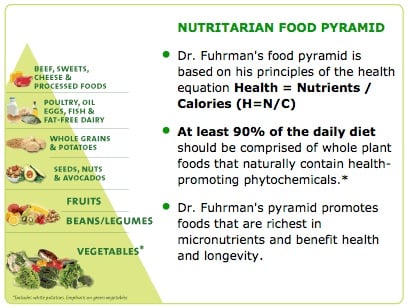
H=N/C
Your health (H) is predicted by your nutrient intake (N) divided by your calorie intake (C).
This straightforward formula defines the nutrient density of your diet. It is the basis of nutritional science and nutritional healing and is a critical concept that Dr. Fuhrman uses in his dietary recommendations.
Food supplies both nutrients and calories (energy). All calories come from only three elements: carbohydrates, fats, and proteins. We need these in large quantities and, along with water, are called macronutrients.
Micronutrients, on the other hand, are non-caloric food factors, such as vitamins, minerals, fibers, and phytochemicals. These non-caloric nutrients are vitally important for good health. The key to optimizing your health and achieving your ideal body weight is to eat predominantly those foods that have a relatively high proportion of nutrients (non-caloric food factors) to calories (carbohydrates, fats, and proteins).
Dr. Fuhrman’s refers to his dietary style as a Nutarian diet because it is based on choosing an adequate amount of foods that have the highest nutrient density. Adequate consumption of foods high in vitamins, minerals and phytochemicals is essential for a healthy immune system and to empower your body’s detoxification and cellular repair mechanisms to protect you from cancer and other diseases.
If you need to lose weight, you will find that the more nutrient dense food you consume, the more you will be satisfied with fewer calories and the less you’ll crave low-nutrient, empty calorie foods. You will also keep the weight off as this is an eating plan for life that you will come to appreciate and love.
How do you know which foods to choose? To answer this question, and help visualize the H=N/C equation and make it practical, Dr. Fuhrman created the aggregate nutrient density index, or ANDI. The ANDI ranks many common foods on the basis of how many nutrients they deliver to your body for each calorie consumed. It also helps you visualize how nutrient dense green vegetables are and how foods compare with one another. Foods are rated on a scale of 1-1000.
Food labels list only a few nutrients, but ANDI’s are based on thirty-four important nutritional parameters. The ANDI is a simple way to help you identify and eat larger amounts of nutrient-rich foods. The higher the ANDI and the greater percentage of those foods in your diet, the better your health will be.
Not surprisingly, the foods that have a high ANDI score are straight from nature, primarily vegetables and fruits. Nutritional science in the last twenty years has demonstrated that colorful plant foods contain a huge assortment of protective compounds. Only by eating an assortment of these nutrient-rich natural foods can we access these protective compounds and prevent the common diseases that afflict Americans.
To see how well the foods you eat rate, take a look at this sample of ANDI scores.
*The other 10 percent may include minimally processed foods such as tortillas, coarsely-ground or sprouted whole grain breads or cereals, tofu, tempeh and a limited amount of animal products, preferably not more than 5 percent of total caloric intake. Though the ANDI (Aggregate Nutrient Density Index) is not the only thing that excellent nutrition needs to consider, attention should be given to consuming a variety of high ANDI scoring plant foods, to maximize immune function and lifespan. Dr. Fuhrman specifically recommends that people consume greens, beans, onions, mushrooms, berries, seeds and tomatoes on a regular basis to maximize immune function and protection against cancer.